American Climate Perspectives Survey 2022, Vol. III
Support for Nuclear, Wind, and Solar Trending in 2022

Amidst power outages, record-high gas prices, and the need for Americans to cool down in soaring heat waves, energy and electricity are in high demand nationwide. Climate change is making access to reliable energy a factor in morbidity and mortality rates. How have these impacts affected Americans’ energy attitudes? Find out below.
ecoAmerica surveyed Americans nationwide and found high and consistent support for research and development of wind and solar energy, growing support for — and declining concerns about — nuclear energy, and lower American understanding of energy-source contribution to climate change. Repeated scientific polling was conducted over five years to observe these trends.
Support for Research and Development Increases for Nuclear, Remains High for Wind and Solar
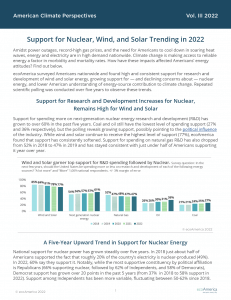
Support for spending more on next-generation nuclear energy research and development (R&D) has grown to over 60% in the past five years. Coal and oil still have the lowest level of spending support (27% and 36% respectively), but the polling reveals growing support, possibly pointing to the political influence of the industry. While wind and solar continue to receive the highest level of support (77%), ecoAmerica found that support has consistently softened. Support for spending on natural gas R&D has also dropped from 52% in 2018 to 47% in 2019 and has stayed consistent with just under half of Americans supporting it year over year.

A Five-Year Upward Trend in Support for Nuclear Energy
National support for nuclear power has grown steadily over five years. In 2018 just about half of Americans supported the fact that roughly 20% of the country’s electricity is nuclear-produced (49%). In 2022, 60% say they support it. Notably, while the most supportive constituency by political affiliation is Republicans (66% supporting nuclear, followed by 62% of Independents, and 58% of Democrats), Democrat support has grown over 20 points in the past 5 years (from 37% in 2018 to 58% support in 2022). Support among Independents has been more variable, fluctuating between 50-62% since 2018.

Males, Republicans, and Americans Over Sixty Among Top Nuclear Supporters
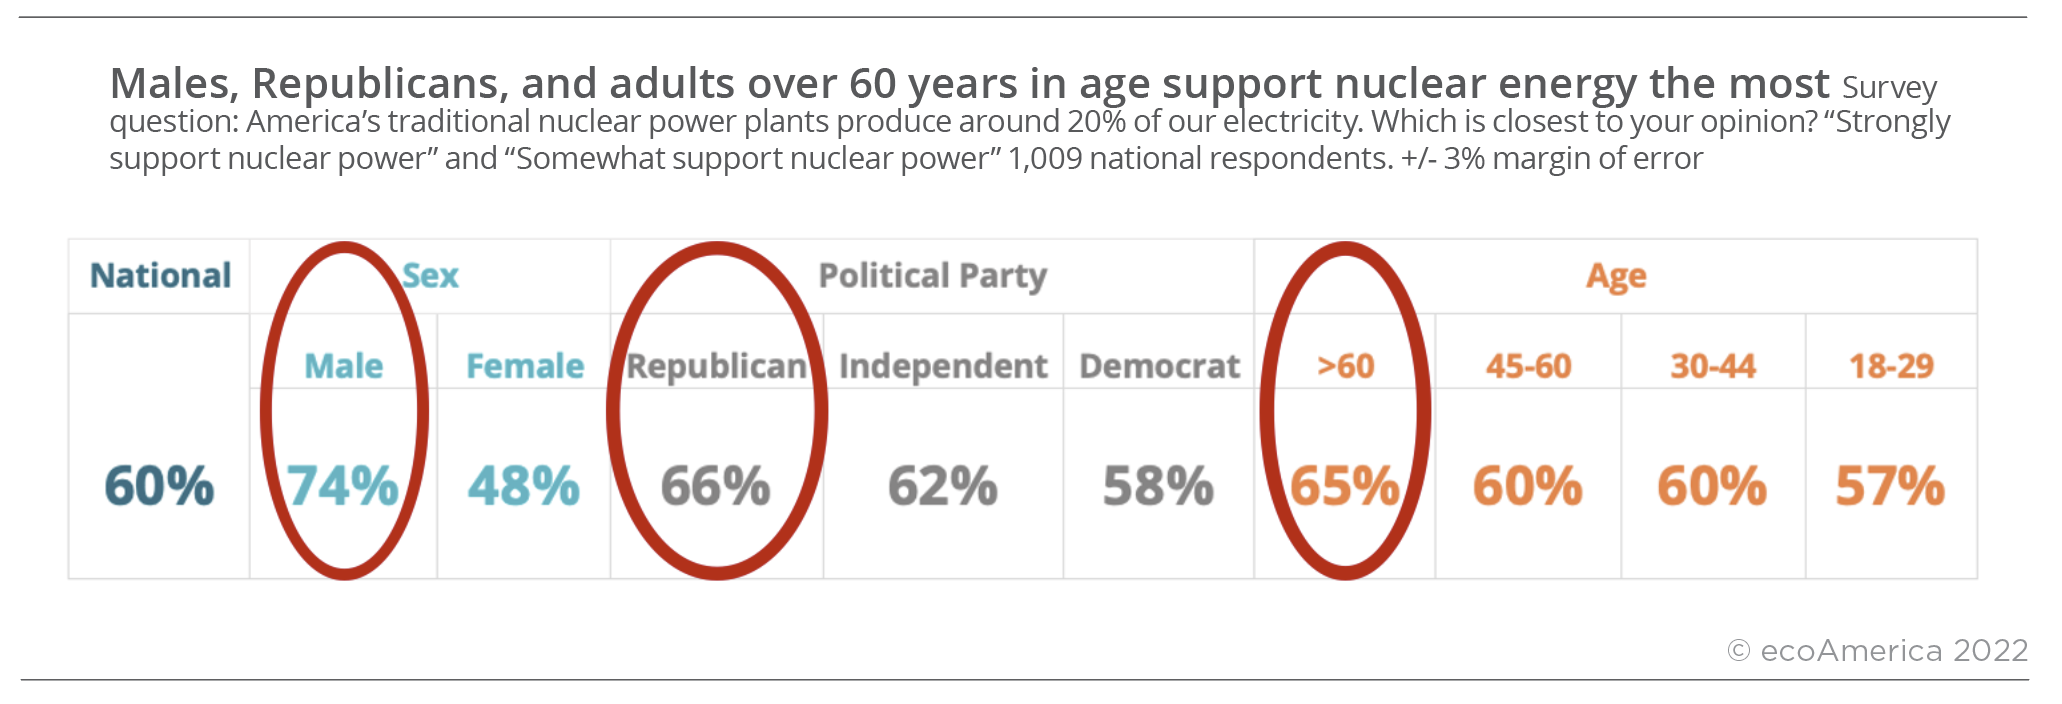
For the second year in a row, males report the highest level of support for nuclear energy in the US when compared to other demographic groups. 74% of males say they either strongly or somewhat support nuclear power. As shown below, 66% of Republicans say they support nuclear power. A closer look at age reveals that 65% of Americans over 60 support nuclear compared to 60% of those between 45-60, 60% of those between 30-44, and 57% of younger Americans between 18-29. Among the demographics examined, females report the lowest level of support, with only 48% saying they either strongly or somewhat support nuclear power.

Concerns About Nuclear Energy Remain, Show Decreasing Trends
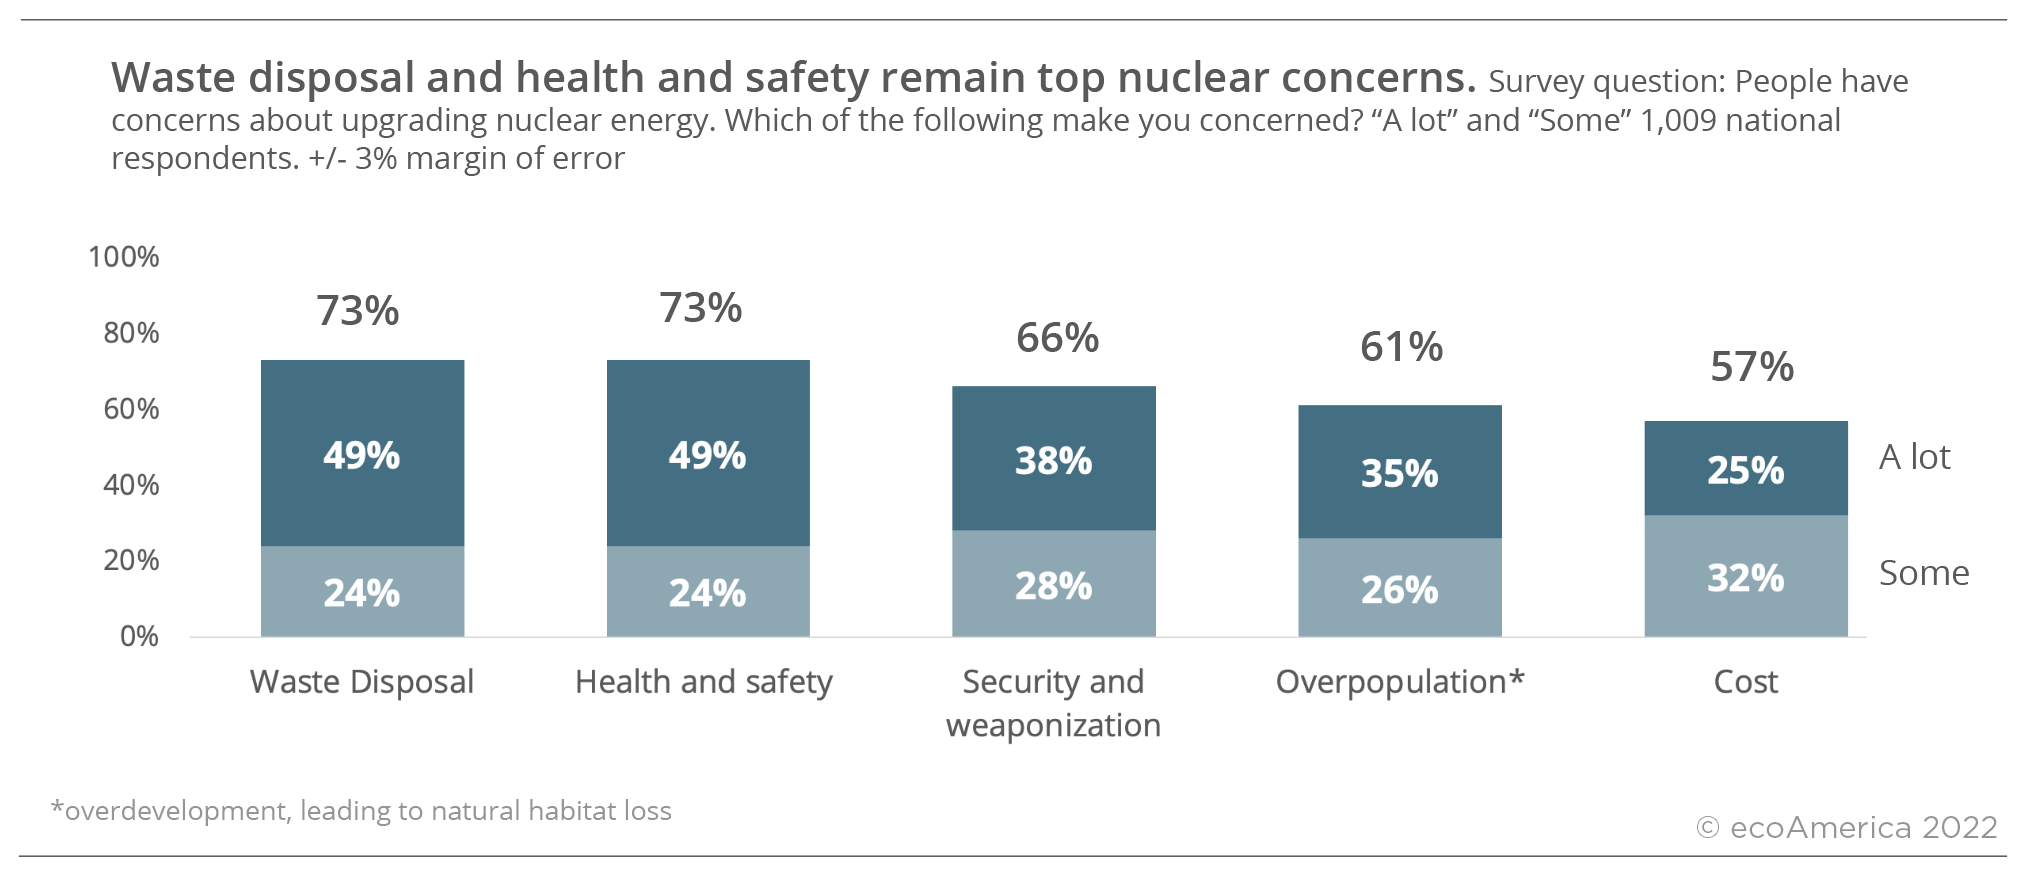
Nearly 3 in 4 Americans (73%) report concern about the health and safety of nuclear energy, and an equal number report concern about nuclear waste disposal. This includes 49% of Americans who say waste disposal and health and safety concern them “a lot”. While fewer, a majority still voice concern about security and weaponization (66%), including 38% who say security and weaponization concern them “a lot”. Just over 3 in 5 Americans (61%) say they’re concerned about overpopulation and 57% say they are concerned about cost.

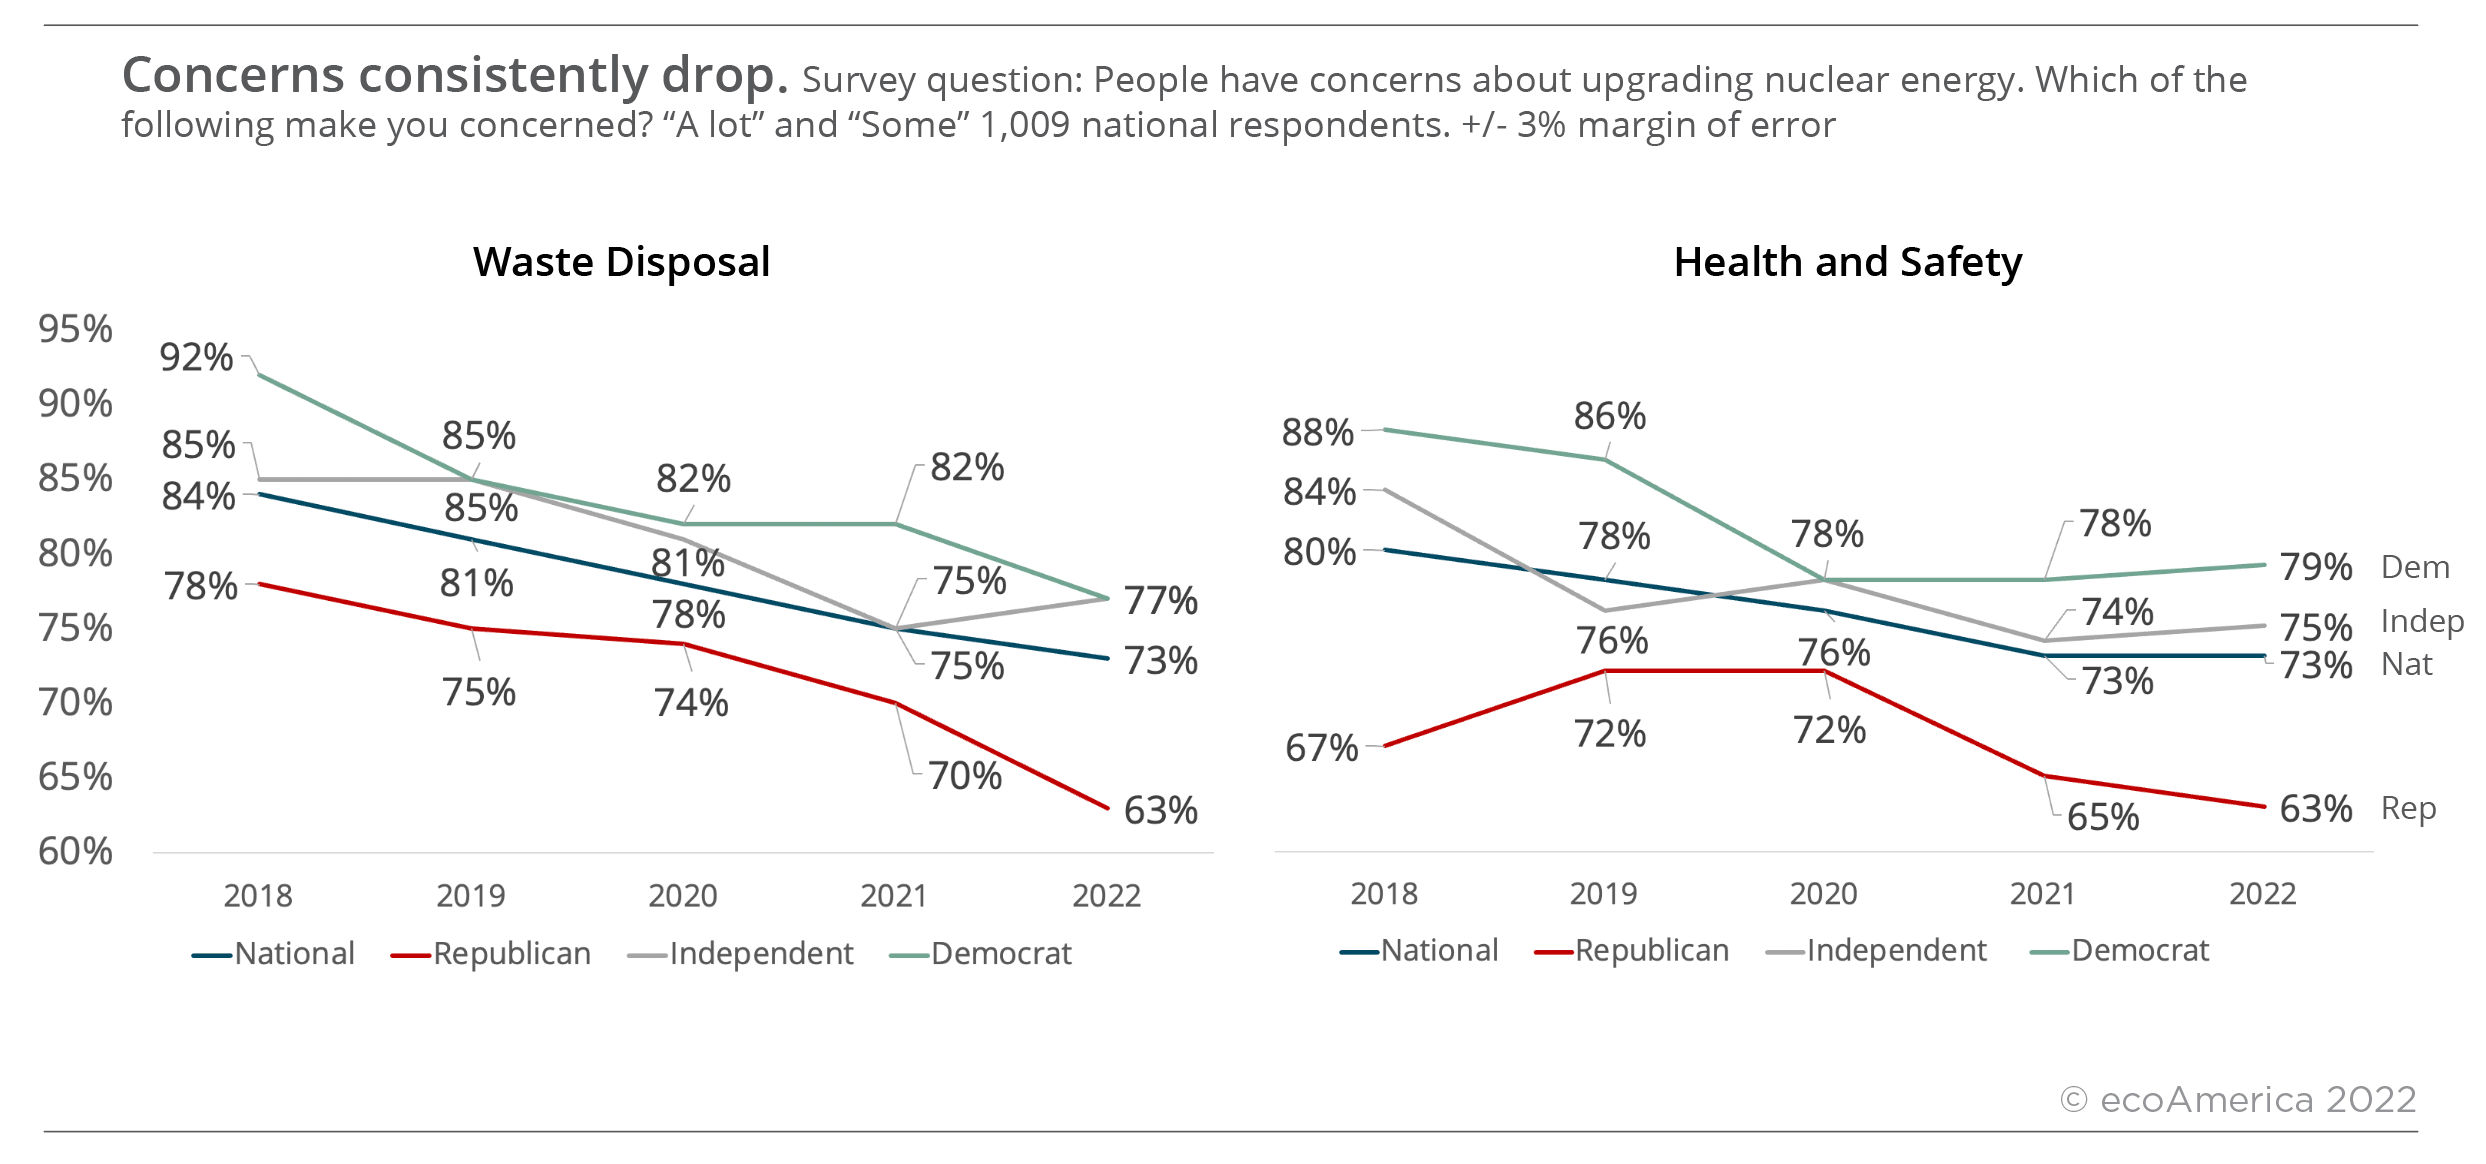
While waste disposal and health and safety remain top nuclear-related concerns for Americans, trends show decreased concern over the past 5 years. Concerns about waste disposal dropped 11 points nationally from 84% of Americans concerned in 2018 to 73% in 2022. The largest drops in concern are observed among Democrats and Republicans. Independent concern has gone down, but less dramatically.
American concerns about health and safety decreased 7 points from 80% in 2018 to 73% in 2021 and remain consistent at 73% in 2022. In 2019 and 2020, 72% of Republicans voiced concerns over health and safety. That dropped to 65% in 2021 and 63% in 2022. Democrat concerns dropped significantly in 2020 and have remained near 79% over the past two years. Independent concern has fluctuated but since 2018, dropped 9 points from 84% to 75%.

Fewer Americans Connect Oil/Coal to Climate Change
Burning fossil fuels is the top driver of climate change and unhealthy air pollution. However, ecoAmerica’s research shows that the percentage of Americans making that connection may be waning. In 2022, 76% of Americans said that oil contributed to unhealthy air pollution and climate change, compared to 82% in 2018. Following oil, 73% of Americans said that coal contributed to unhealthy air pollution and climate change compared to 81% in 2018. In contrast, more Americans (21%) say that wind and solar contribute compared to 4 years ago.

Full data featured in this blog is available in the accompanying toplines
Methodology
ecoAmerica designed and administered this survey, which was conducted online on July 5-7, 2022 using Survey Monkey. The survey yielded a total of 1,009 complete adult responses and used the Census Bureau’s American Community Survey to weigh the national general population and reflect the demographic composition of the US. Respondents were asked for information on their sex, race/ethnicity, age, state, and education level so Survey Monkey could weigh the results to be nationally representative. The sample was drawn from an online panel and the respondents were screened to ensure that they were over the age of 18. The margin of error for the sample is +/-3%. In interpreting the survey results, it is important to note that all sample surveys are subject to possible sampling error. Thus, the results of a survey may differ from the results that would be obtained if the entire population was interviewed. The size of the sampling error depends upon both the total number of respondents in the survey and the percentage distribution of the responses to a particular question. For example, if 50% of the respondents in a sample of 1,009 respondents answered, “Yes” to a particular question, we can be 95% confident that the true percentage would fall within 3 points, or range from 47% to 53%.
Suggested Citation
Speiser, M., Hill, A. N. (September, 2022). American Climate Perspectives Survey 2022. Support for Nuclear, Wind, and Solar Trending in 2022. ecoAmerica. Washington, DC.
© 2022 ecoAmerica. The contents of this report may be shared and used under a Creative Commons Attribution Non Commercial NoDerivatives 4.0 International License.
For more information contact us at research@ecoAmerica.org.
Subscribe to receive ecoAmerica’s research in your inbox.