American Climate Perspectives Survey 2020, Vol. IV
Elections 2020: Voters Stand With Climate Candidates
Amidst a national rise of COVID-19 cases, many election officials have expanded vote by mail in hopes of making it easier for Americans to cast their ballot, reducing voter suppression methods and fear of contracting or spreading the virus. With the November election approaching, and economic, racial, and public health crises intensifying, ecoAmerica was eager to find out how Americans were thinking about another urgency—climate. Building on ecoAmerica’s June report, American Climate Perspectives Survey 2020 Vol. III, Climate Is a Voting Issue, this latest report finds that voters support climate candidates and want to know candidates’ position on climate change. Further, ecoAmerica finds that fewer young Americans (who have been shown to have higher support for climate solutions) plan to vote compared to other age groups.
Americans Want Climate Leaders in Office
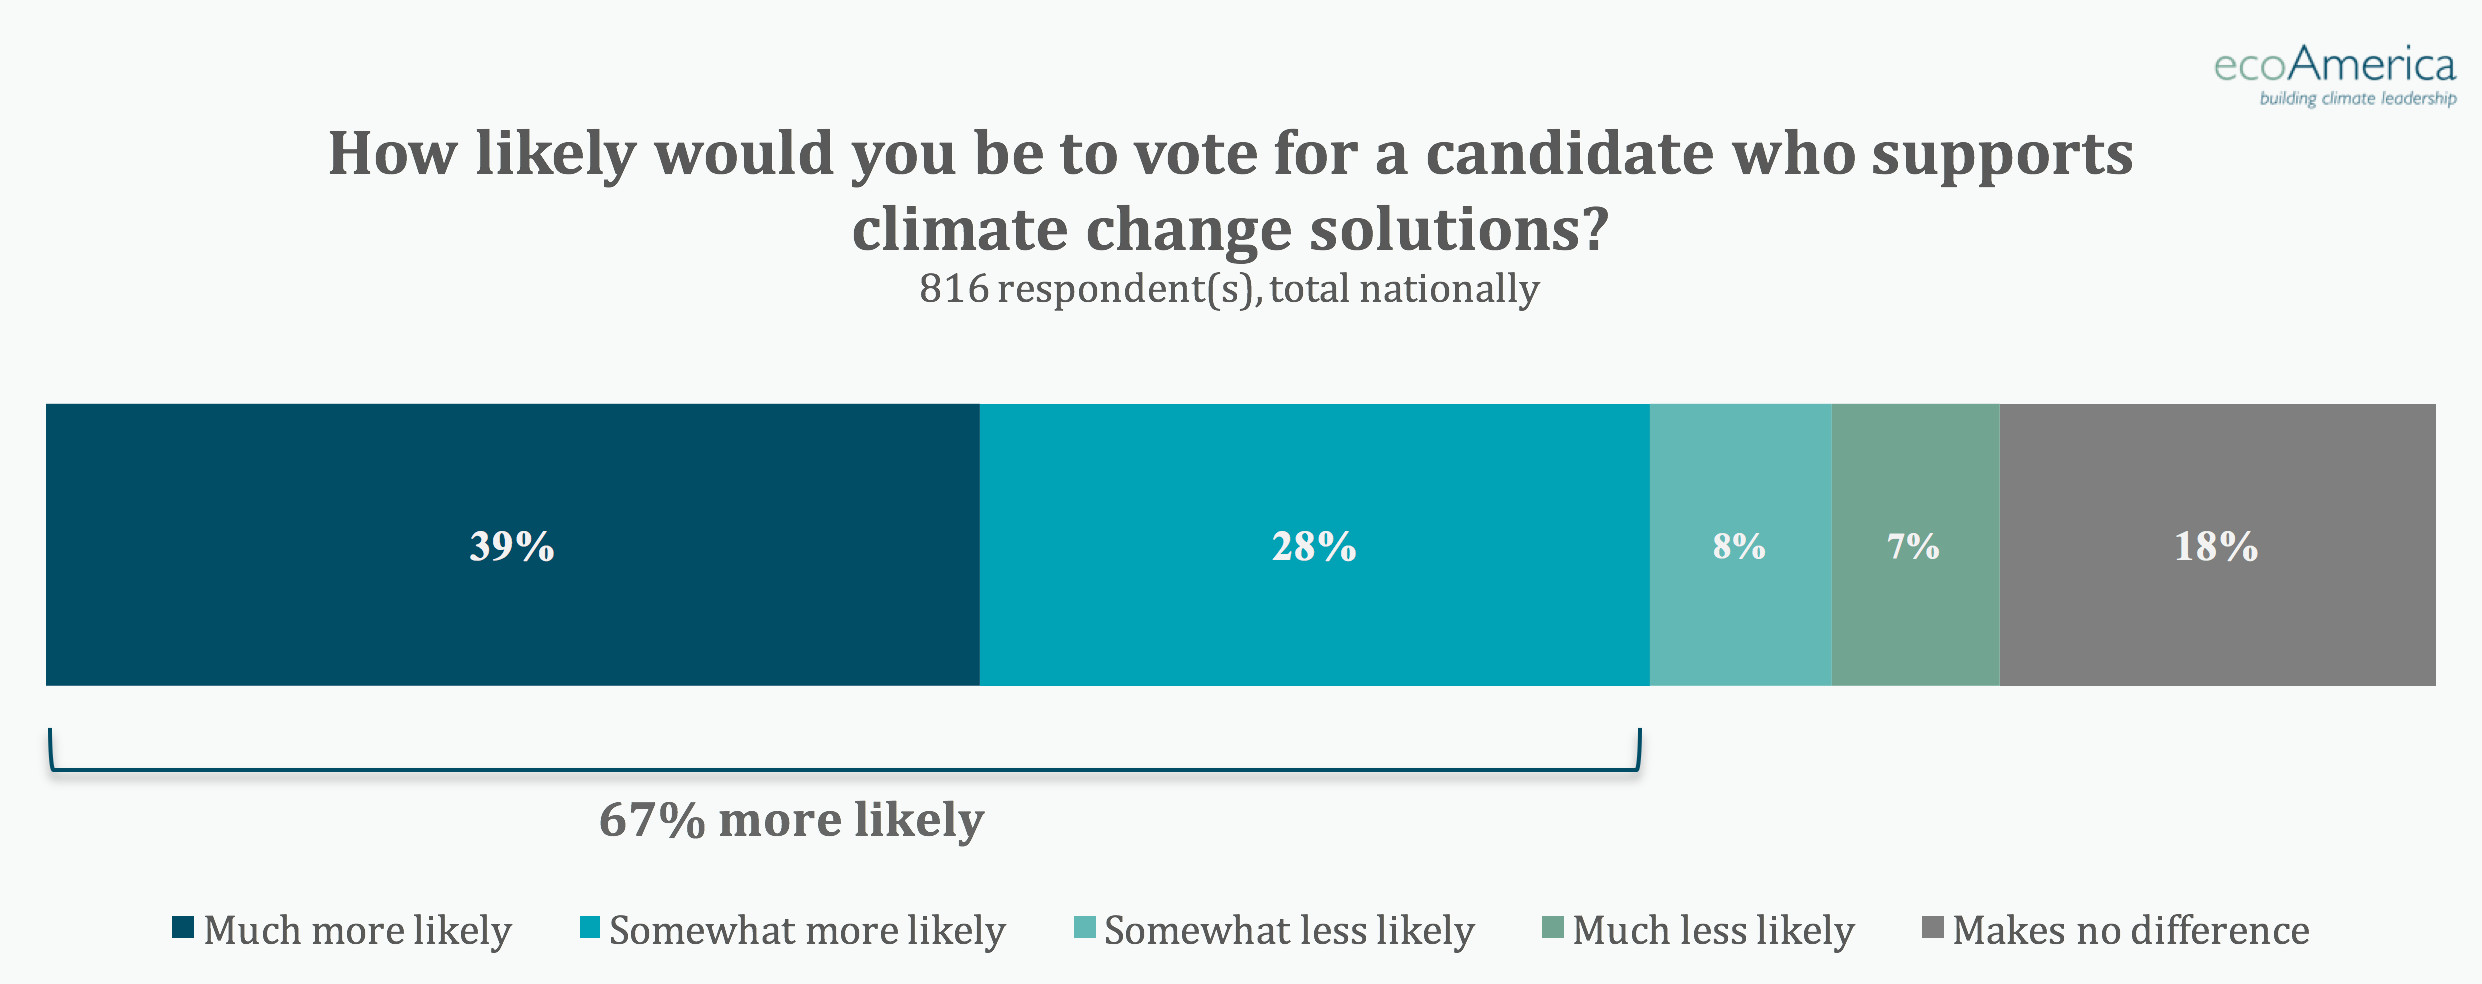
One of ecoAmerica’s key findings shows that Americans back climate candidates. 67% of Americans are more likely to vote for a candidate who supports climate solutions, with 39% reporting they are much more likely and 28% reporting they are somewhat more likely. There is unity between Democrats and Independents on the issue with the majority of voters reporting that they are more likely to vote for a candidate who supports climate solutions (88% of Democrats say they are more likely and 74% of Independents say they are more likely), while only 39% of Republicans are more likely.
Democrats Are Eager to Know More About Candidates’ Positions on Climate Change
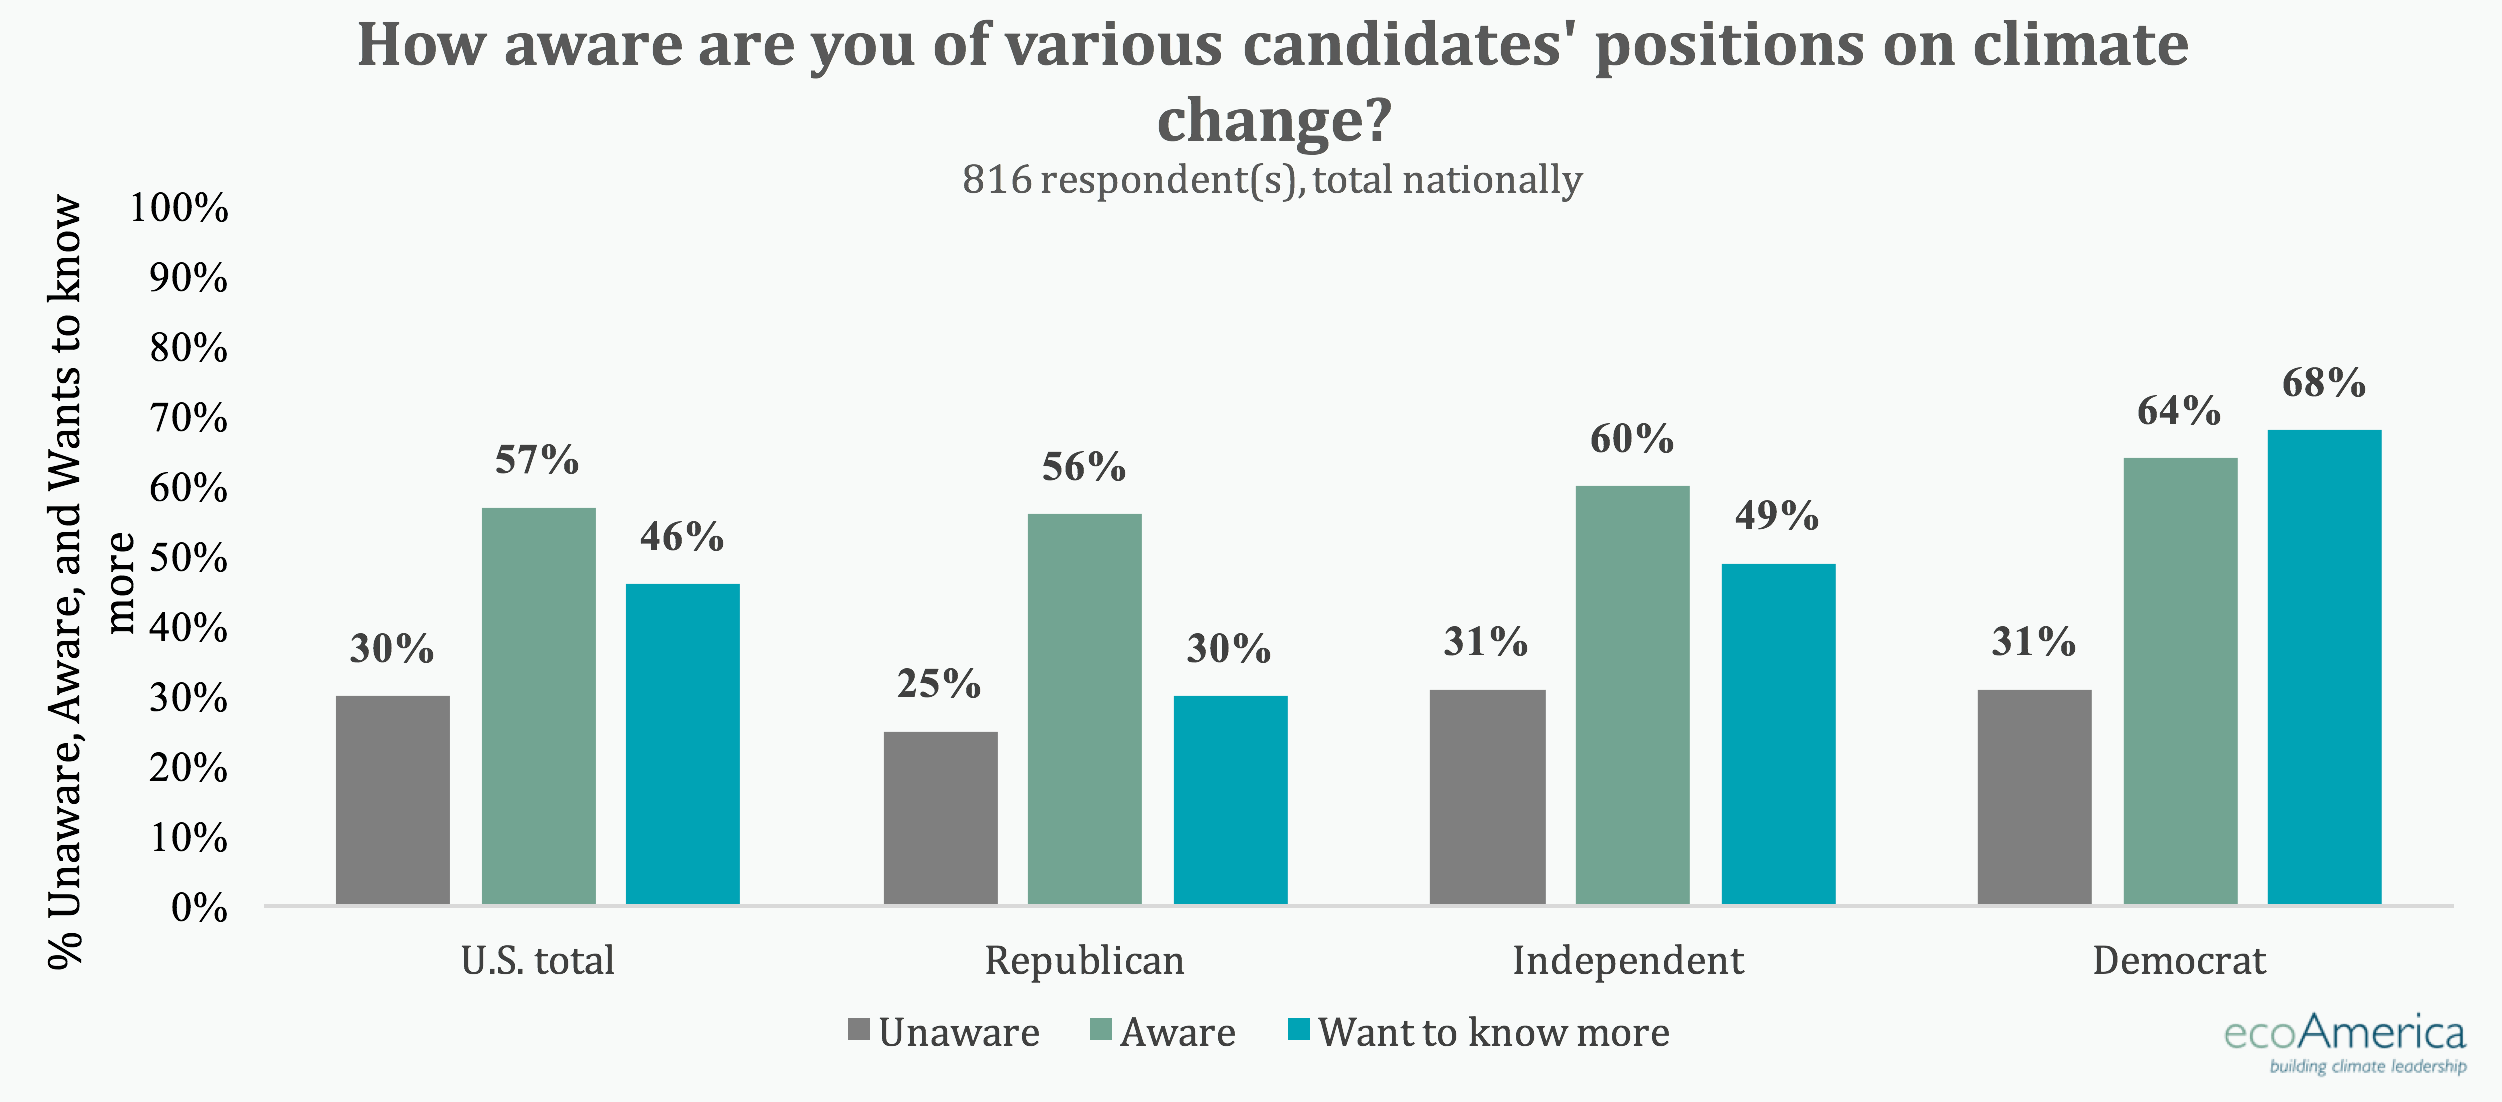
Many Americans (57%) are aware of candidates’ positions on climate change and nearly half (46%) want to know more. More Democrats report being aware (64%) more than any other political party and are also eager to learn more. 68% of Democrats say they want to know more about candidates’ climate stances, reporting 19 percentage points higher than Independents (49%) and 38 percentage points higher than Republicans (30%).
Americans Are More Likely to Vote for Climate, but Will They Show Up?
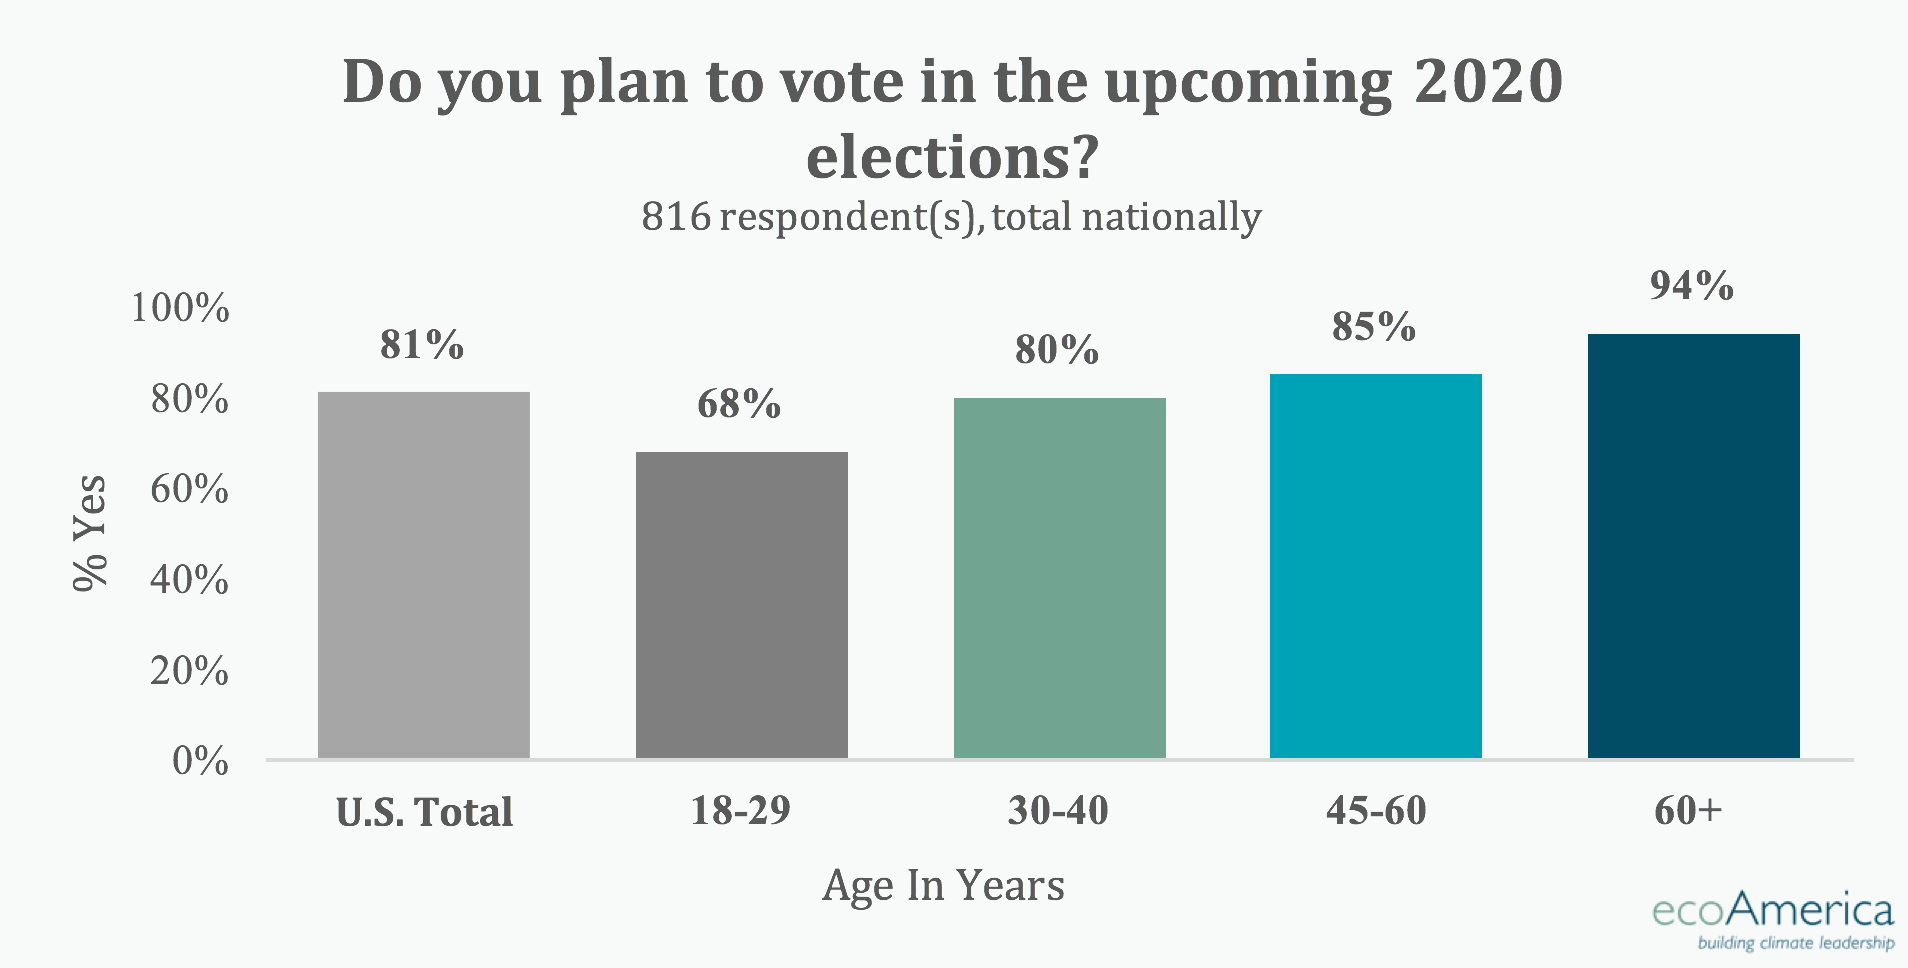
The majority of Americans report that they are planning to vote in the upcoming 2020 elections but ecoAmerica’s findings highlight the variation between age groups. Nearly 1/3 (32%) of young Americans between the ages 18-29 are either not planning to vote or are unsure if they will vote. However, according to Tufts CIRCLE analysis, the majority of U.S. states saw an increase in young voter numbers between 2014-2018, with some states such as Montana and Washington seeing a two-fold increase in turnout. This age group may hold significant weight in November. Pew Research Center reports that Americans born after 1996, often referred to as Generation Z, will make up 1/10 of eligible voters. Generation Z paired with Millennials (Americans born between 1981-1996) make up over 1/3 (36%) of eligible voters across the nation. This age group is known to hold amongst the highest concern for climate change. Meanwhile, 94% of Americans over 60 reported that they are planning to vote, 85% of Americans 45-60 are planning to vote, and 80% of Americans 30-40 are planning to vote.
Ensuring that all Americans exercise their right to vote will be critical this election season. For voting resources, view ecoAmerica’s Get Out the Vote resource page.
Full data is available in the accompanying toplines.
Share these finding on Social Media! Click here for the social toolkit, including:
Methodology
ecoAmerica designed and administered this survey, which was conducted online May 5th – May 6th, 2020 using Survey Monkey. The survey yielded a total of 816 adult responses. The sample was drawn from an online panel and the respondents were screened to ensure that they were over the age of 18. The margin of error for the sample is +/-3%. In interpreting the survey results, it is important to note that all sample surveys are subject to possible sampling error. Thus, the results of a survey may differ from the results that would be obtained if the entire population was interviewed. The size of the sampling error depends upon both the total number of respondents in the survey and the percentage distribution of the responses to a particular question. For example, if 50% of the respondents in a sample of 816 respondents answered, “Yes” to a particular question, we can be 95% confident that the true percentage would fall within 3 points, or range from 47% to 53%.
Suggested Citation
Speiser, M., Hill, A. (July 2020). American Climate Perspectives Survey 2020. Vol. IV: Elections 2020: Climate Is a Voting Issue. Part 2. ecoAmerica. Washington, DC .
© 2020 ecoAmerica. The contents of this report may be shared and used under a Creative Commons Attribution Non Commercial NoDerivatives 4.0 International License.
For more information contact us at research@ecoAmerica.org.
Subscribe to receive ecoAmerica’s research in your inbox.